When a symptom percentage appears beside a treatment name, the natural question is what it means for the next conversation with a clinician. Answering that question starts with the clock behind the percentage. Entry into a study, entry into a comparison, and the beginning of a symptom are different starting points. Treating them as interchangeable changes the question a result appears to answer.
This guide develops an editorial interpretation of the accompanying research figure. Its population, observation window, treatment descriptions and numerical results stay attached to the chart. The discussion explains how to read those definitions, which missing details a percentage cannot reconstruct, and what additional documentation would be needed before drawing conclusions about follow-up. The purpose is a more precise reading of evidence, not a personal treatment schedule.
Reading the evidence
- Name the starting point
- An elapsed interval needs an origin before it can be interpreted.
Sources: Wharton 2022
- Keep the denominator attached
- Changing the population changes the question, even when the outcome label stays the same.
Sources: Wharton 2022
- Separate people from episodes
- A proportion of people does not preserve every event in their histories.
Sources: Wharton 2022
- Distinguish observation from response
- An event record alone does not establish when someone reviewed or acted on it.
Sources: Wharton 2022
- Use the right evidence for a decision
- An analysis convention cannot supply an individual care instruction.
Sources: Wharton 2022; Wegovy label
Semaglutide reports
STEP 4 · New-onset GI · Weeks 20–68 · Weekly subcutaneous 2.4 mg
On-treatment: dose within previous 49 days; not response times.
Sources: Wharton 2022
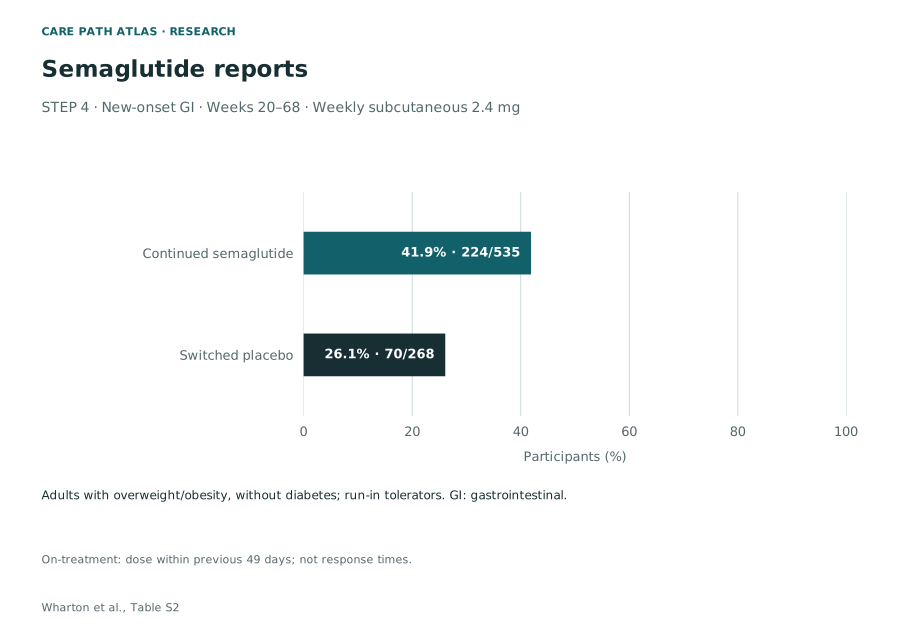
Adults with overweight/obesity, without diabetes; run-in tolerators. GI: gastrointestinal.
| Arm | n/N | Percent |
|---|---|---|
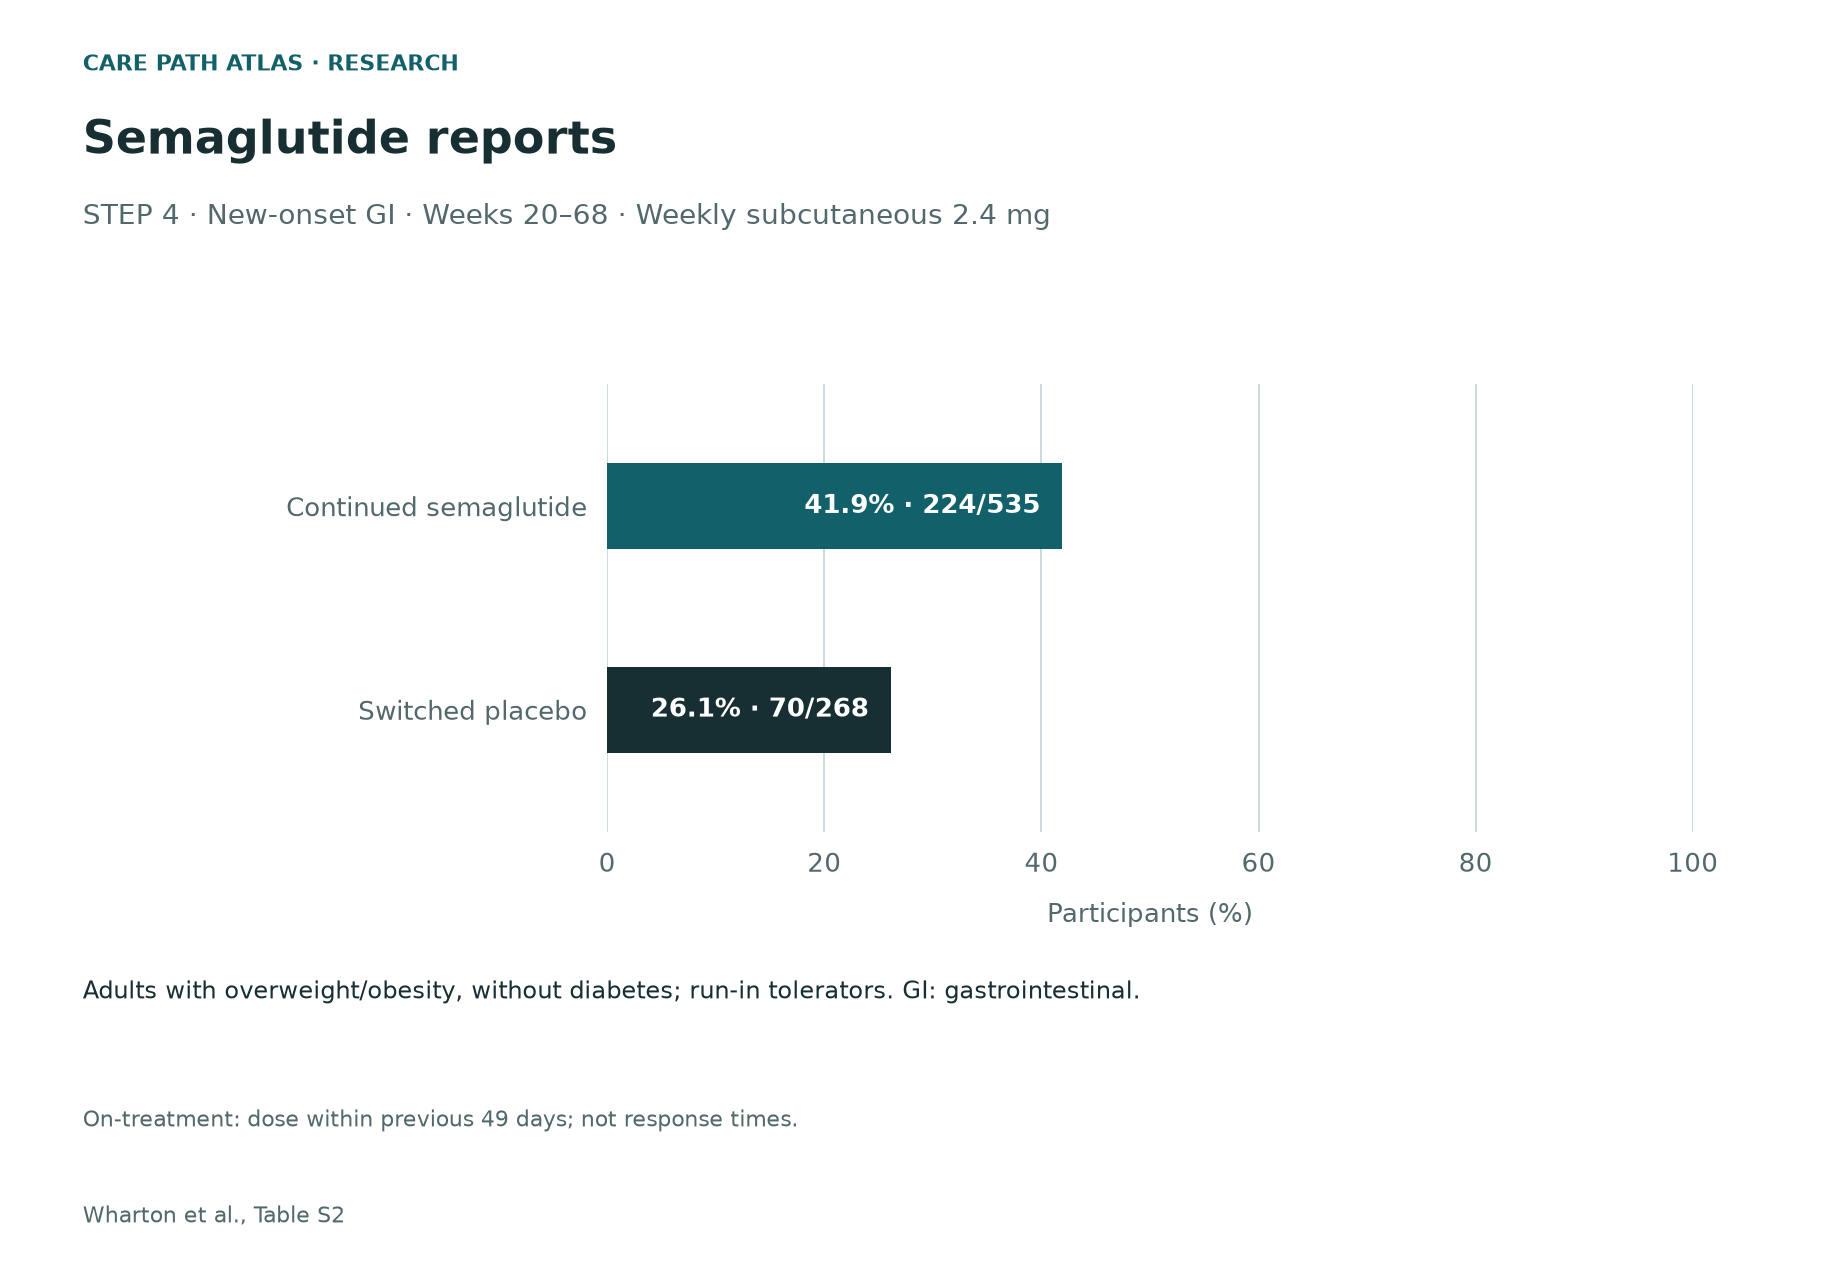
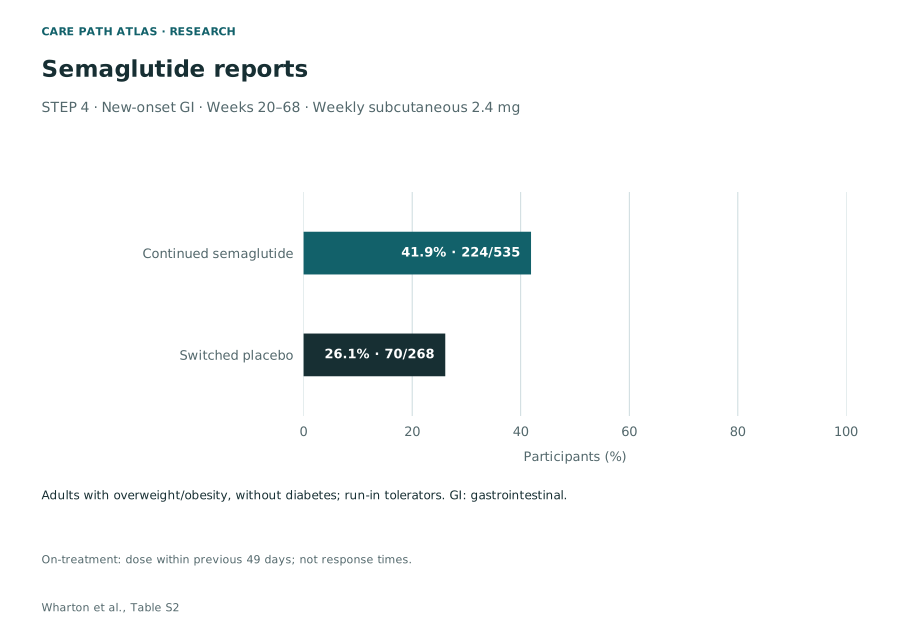
| Continued semaglutide | 224/535 | 41.9% |
| Switched placebo | 70/268 | 26.1% |
Read the question before comparing the bars
Wharton et al. conducted post hoc analyses. Novo Nordisk funded the trials; three authors were employees and shareholders.
The useful first step is to turn the chart into a sentence with blanks: among whom, beginning when, under which definition, how many had the specified outcome? Filling those blanks keeps the result connected to its measurement. A percentage without them is portable but ambiguous. It can easily acquire a broader population or a different meaning as it moves from a research table to a short description.
Read each row across before reading down the column of percentages. The numerator describes a qualifying count; the denominator identifies the group against which that count is expressed. The caption supplies the scope that the bar length cannot show. A longer bar answers the stated numerical question. It does not independently explain the history of every person represented by it.
Our guide to comparing GLP-1 care routes offers a separate place to organize service questions. The editorial connection is about evidence discipline: a clinical table and a service description each need a clearly stated subject. Moving a number between those subjects requires justification, not merely a shared treatment name.
Sources: Wharton 2022
Keep three different clocks on the page
A study history can be indexed from entry into a process, entry into a particular comparison, or onset of an event. None is automatically the correct origin for every question. The choice depends on whether the question concerns the whole journey, a defined decision point, or what happened after a particular occurrence. Subtracting dates before choosing that origin produces a precise interval with an unclear meaning.
Consider an invented equipment-monitoring example. Two devices enter a workshop on Monday. One begins a comparison test on Tuesday and the other on Friday. Both develop a warning on Saturday. Their warnings occur on the same calendar date, but at different elapsed times from test entry. This is a demonstration of date arithmetic, not a representation of trial participants or their symptoms.
For the plotted evidence, keep the figure’s starting point visible whenever you describe the result. A later observation window cannot simply be renamed the entire experience since first contact. Nor should the date of a database entry silently replace the date of the event it describes. The table below is an original reading aid for keeping those questions distinct.
| Question | Timestamp needed | Inference still unavailable |
|---|---|---|
| How long since entry? | Defined entry date | When a later event began |
| How long within the comparison? | Comparison start date | Experience before that boundary |
| How long since onset? | Event onset date | When a report was reviewed |
Sources: Wharton 2022
Selection and allocation answer separate questions
Selection asks who reaches the point where a comparison is made. Allocation asks how the options are assigned among those people. These questions operate at different stages. A fair allocation procedure within a defined group does not make that group interchangeable with everyone who entered an earlier stage. Conversely, a selected group does not by itself make the allocation within it unfair.
The interpretation should therefore preserve the condition attached to the figure’s population. Think of the result as an answer with an eligibility clause, rather than deleting that clause to make the conclusion shorter. The scientific issue is applicability: which features of the population would need to be similar before the result could inform a different setting? Similarity cannot be established by the treatment name alone.
This distinction also helps separate limitations from accusations. Identifying a restricted population describes the reach of an inference; it is not a claim that investigators manipulated a result. Our explanation of what a state filter establishes applies the same documentary habit to a different subject: specify what was checked before extending its meaning to a broader access question.
Sources: Wharton 2022
An onset date is different from a recording date
An event can begin before a chosen boundary and still be present after it. Alternatively, it can begin after the boundary but be entered into a record later. These possibilities require different timestamps. A rule concerned with new beginnings asks a different question from a rule concerned with everything present during an interval. Neither description should be substituted for the other merely because both concern the same symptom category.
The practical reading task is to identify the verb in the outcome definition. Began, persisted, was reported and was recorded describe different relations to time. They can refer to the same underlying occurrence while producing different classifications. Without the relevant dates, an analyst cannot reliably move an occurrence from one classification to another.
This matters when interpreting the figure’s window. Its boundary is part of the measurement, not a universal dividing line between clinically meaningful and unimportant experiences. A record outside a particular analysis window may still matter to another question. Equally, an event included in an analysis does not reveal its full duration. The missing information must be sought in an appropriate event history rather than inferred from membership in a count.
Sources: Wharton 2022
A treatment window is an analysis rule
The exposure definition beside the chart tells the reader how the analysis connects events with treatment history. A definition of this kind is a classification rule. It provides a reproducible way to include observations, but should not be translated into proof of uninterrupted exposure on every calendar day. Those are different claims and would require different records.
Ask what information would be necessary to distinguish them. A classification might require a recorded treatment date and an event date. Establishing a continuous history would require a more complete sequence, including the meaning of any gaps. Adding confidence to the first classification does not create the missing sequence. Precision about an operational definition is valuable precisely because it limits what the category means.
The same distinction prevents an especially consequential mistake: turning an analysis boundary into a personal waiting period or a rule for changing treatment. A statistical inclusion convention was designed to organize research observations. It does not determine when an individual needs assessment. The intake preparation guide is a useful place to organize questions about where personal instructions and contact details will come from.
Sources: Wharton 2022
Count people without inventing their histories
A proportion expressed in people compresses information. It distinguishes whether someone met the relevant condition, while leaving the sequence of qualifying occurrences outside that summary. Repeated episodes do not become visible merely because the percentage is reported to a decimal place. A precise summary can still be a deliberately incomplete description of a history.
The denominator also belongs to its own row. Replacing it with a combined population would change the question from a within-group proportion to something else. Before performing arithmetic, identify both the unit being counted and the population against which it is counted. People, episodes, messages and consultations are not interchangeable units, even when they concern the same person.
Our companion analysis of tirzepatide symptom records develops another measurement question: what information is retained when histories are reduced to categories. Read it as a companion in interpretation, not a treatment comparison. A calculation is only as meaningful as the relationship between its units. The chart alone cannot tell us how many messages were sent, which were duplicates, or which led to an assessment.
Sources: Wharton 2022
The same total can conceal different timelines
A second invented, nonclinical example shows the information problem. Imagine ten sensors observed for one month. Four issue a warning. In one possible history, all four warnings begin near the start; in another, all begin near the end. Both histories produce the same proportion of sensors with a warning. The final count cannot tell the two histories apart.
That ambiguity is not removed by calculating the proportion more accurately. A daily rate would need information about time at risk; a typical duration would need information about beginnings and endings. A response interval would need a defined initiating event and a later response timestamp. None can be reconstructed uniquely from an overall count of qualifying people.
This is a useful test for an interpretation of the figure: could very different timelines produce the same displayed values? If so, an assertion about those timelines needs additional evidence. For example, a conclusion about speed requires timing information, rather than a general impression that the reported proportion is large or small. The clinic appointment request guide can help organize timing questions, but it does not turn a research proportion into a measured service response.
Sources: Wharton 2022
Separate an observation from an acknowledged response
The record needed to establish that an event occurred is different from the record needed to establish that someone received, reviewed or acted on a report. These are successive questions, but they need not form a complete documented chain. An analyst should avoid filling a missing link with an assumption that the next step must have happened.
An original audit framework begins by defining each state before looking for supporting evidence. Receipt might require an acknowledgment tied to a particular report. Review would require evidence of assessment rather than simple delivery. Action would require a documented decision or instruction with a clear author. These are examples of what evidence could establish, not descriptions of a trial’s internal workflow.
The table translates that framework into questions about records. Keeping the states distinct prevents a category error: using evidence that a symptom was observed as evidence that a service responded promptly. It also prevents a reverse error, in which the absence of response information in a summary is presented as proof that nobody responded. The honest conclusion is that the summary does not establish that separate outcome.
| State to establish | Useful supporting record | Question that remains |
|---|---|---|
| Event described | Dated description with onset meaning | Who received the report? |
| Report received | Acknowledgment linked to the report | Was it clinically assessed? |
| Assessment documented | Attributed assessment and date | What action was communicated? |
| Action communicated | Dated instruction and named responsibility | Was the next question resolved? |
Sources: Wharton 2022
Carry the evidence question into a care conversation
The editorial application is to ask for a documented route from a report to the person responsible for the next unresolved question. Identify the intended channel, what acknowledgment means, and where written instructions for urgent or out-of-hours concerns can be found. These are questions to clarify with the care team; the chart does not answer them for any provider.
When records move between services, ask which information is transferred and how receipt is confirmed. An onset date, a recording date and a later correction should remain distinguishable. Otherwise, a tidy summary can lose the sequence that makes the record interpretable. That is a documentation question, not a recommendation to delay assessment while assembling a perfect history.
Use the whole-service comparison guide to organize these documentary questions alongside the other terms you need to check. A named-provider page, such as our CoreAge Rx access review, is a starting point for checking its linked descriptions. Its inclusion here does not establish availability, a particular treatment offering, clinical results, or a measured response time.
Sources: Wharton 2022
Keep personal care instructions separate from research definitions
Wegovy is contraindicated with personal or family medullary thyroid carcinoma, MEN2, or prior serious hypersensitivity to semaglutide or its ingredients. Its boxed warning concerns rodent thyroid tumors; human relevance is unknown. Warnings include pancreatitis, gallbladder disease, dehydration-related kidney injury and severe gastrointestinal reactions. It is not recommended with severe gastroparesis. Seek prompt assessment for severe or persistent abdominal pain; contact a clinician for severe or persistent gastrointestinal symptoms. Tell the care team about treatment before anesthesia. Study timelines cannot set personal treatment changes.
The reason to keep this information separate is practical. Research definitions tell us how observations were organized for an analysis. Prescribing information and a clinician’s assessment address different decisions. A reader should not use membership in a research category, or the boundaries of an observation window, to settle an individual concern that requires medical judgment.
An evidence reading worksheet can end with two columns in your own notes: what the table establishes, and what you still need to ask. Put population, outcome unit and time origin in the first column only as defined by the figure. Put questions about your circumstances and the responsible care team in the second. Keeping the columns distinct makes the scientific result more useful without expanding its authority.
Sources: Wharton 2022; Wegovy label
Questions about the evidence
Which clock should I use when reading a follow-up result?
Use the origin named by the analysis, then identify whether your own question starts at the same point. A calendar date, an elapsed time since entry and an elapsed time since onset are different descriptions. If the origins differ, explain that difference before comparing the intervals.
Sources: Wharton 2022
Does selection make a randomized comparison meaningless?
No. Selection and allocation address different questions. A comparison may be informative within its defined population while requiring caution when applied beyond it. Identify the eligibility condition and ask what additional evidence would justify extending the conclusion to a different group.
Sources: Wharton 2022
Can a symptom proportion tell me how long symptoms lasted?
Not on its own. A proportion summarizes a qualifying count against a denominator. Duration requires beginning and ending information. Different event histories can yield the same final proportion, so reconstructing a typical timeline from that number alone would add information that the summary does not contain.
Sources: Wharton 2022
Is an event record evidence that someone responded?
It establishes a different part of the evidence chain. To evaluate response, define what counts as receipt, review and action, then seek records supporting those states. Missing response information in an event summary establishes neither a timely response nor the absence of one.
Sources: Wharton 2022
What would support a claim about a provider’s response time?
A defined service population, a clear starting event, a defined response and linked timestamps would be necessary. The meaning of incomplete or unresolved records would also need to be explained. A treatment study percentage cannot substitute for evidence measuring that specific service question.
Sources: Wharton 2022
Editorial assessment
The most useful reading of the figure preserves its boundaries while asking more precise questions. Start with the population, identify the count’s unit, and name the origin of the observation window. Then distinguish information actually retained in the summary from the histories it cannot recover. For care planning, the corresponding task is to identify who owns each unresolved question and what records would establish that it was received and assessed. This is an editorial application of measurement principles. It does not assign a clinical score to a provider or turn a study timeline into personal instructions.
Sources and access
- Gastrointestinal tolerability of once-weekly semaglutide 2.4 mg in adults with overweight or obesity, and the relationship between gastrointestinal adverse events and weight loss.
Full article and supplementary Table S2 checked.
Checked 2026-10-26.
- Gastrointestinal tolerability and weight reduction associated with tirzepatide in adults with obesity or overweight with and without type 2 diabetes in the SURMOUNT-1 to -4 trials.
Full article and supplementary Table S1 checked.
Checked 2026-10-26.
- DailyMed: WEGOVY semaglutide current prescribing information
Current official prescribing information checked.
Checked 2026-10-26.
- DailyMed: ZEPBOUND tirzepatide current prescribing information
Current official prescribing information checked.
Checked 2026-10-26.